Azure Cloud Detection
In this project, our primary focus is on fundamental Azure components, with the ultimate objective of establishing Microsoft Sentinel to identify attacker persistence. Here's a brief overview of our entire configuration:
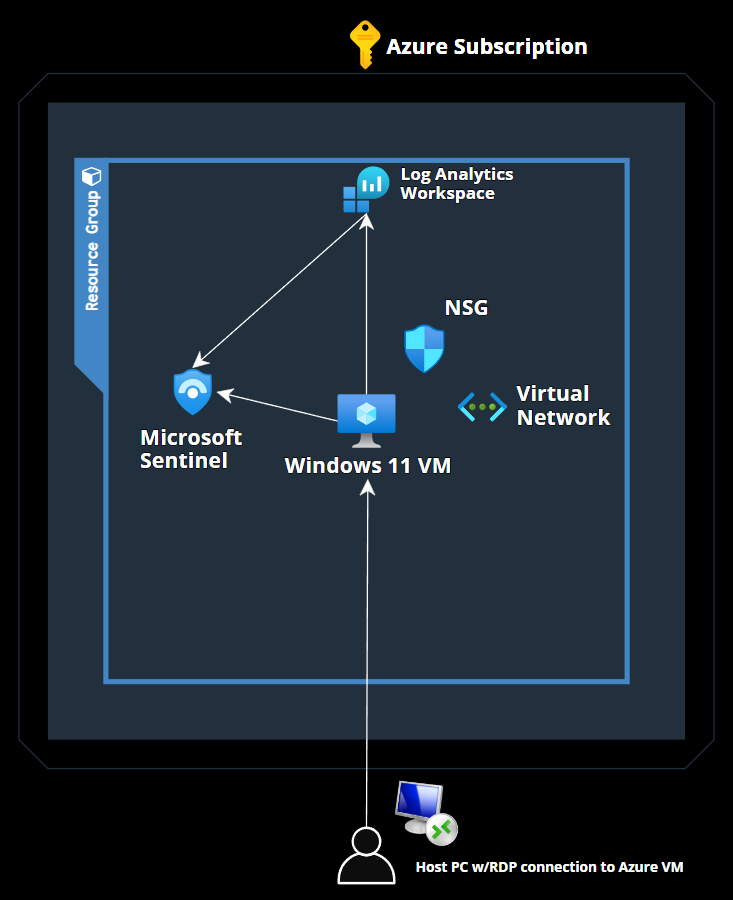
1. Configure and deploy an Azure Resource Group containing the following:
2. Utilize data connectors to import data into Microsoft Sentinel for analysis.
3. Configure Windows security policies and Windows Event Logs in the Security section.
4. Query logs using Kusto Query Language.
5. Develop custom analytic rules to detect Microsoft security events.
6. Utilize the MITRE ATT&CK framework to align with adversary tactics, techniques, and procedures.
MICROSOFT SENTINEL LAB NETWORK DESIGN & TOPOLOGY
Part 1: Set up Azure Resources
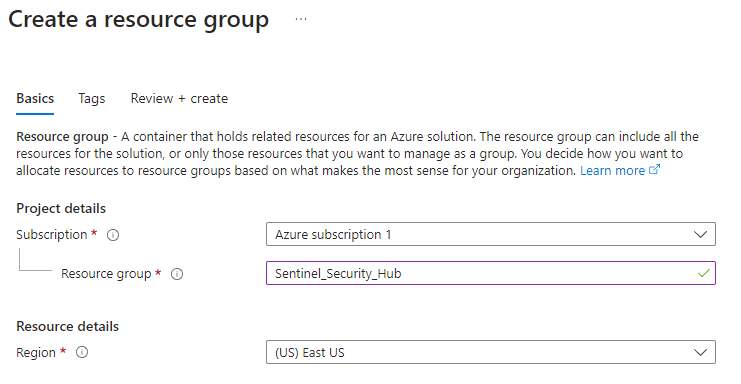
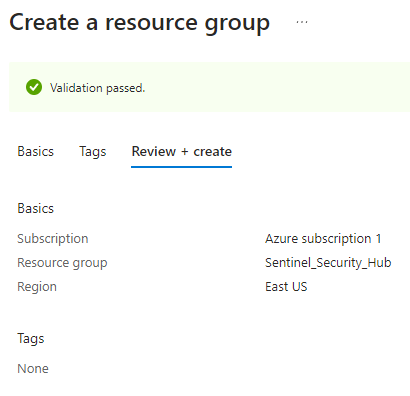
Step 1: Create a Resource Group
This will be our container for all our resources.
Step 2: Deploy a Virtual Machine
Our VM will use Windows 11 as its operating system. We will go with the default settings for now and modify the network settings later.
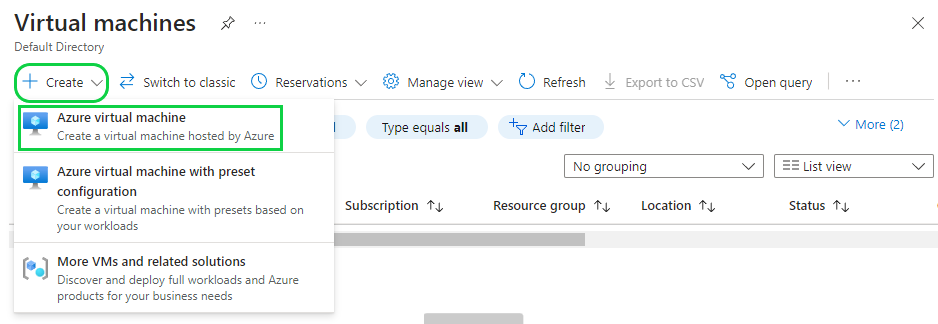
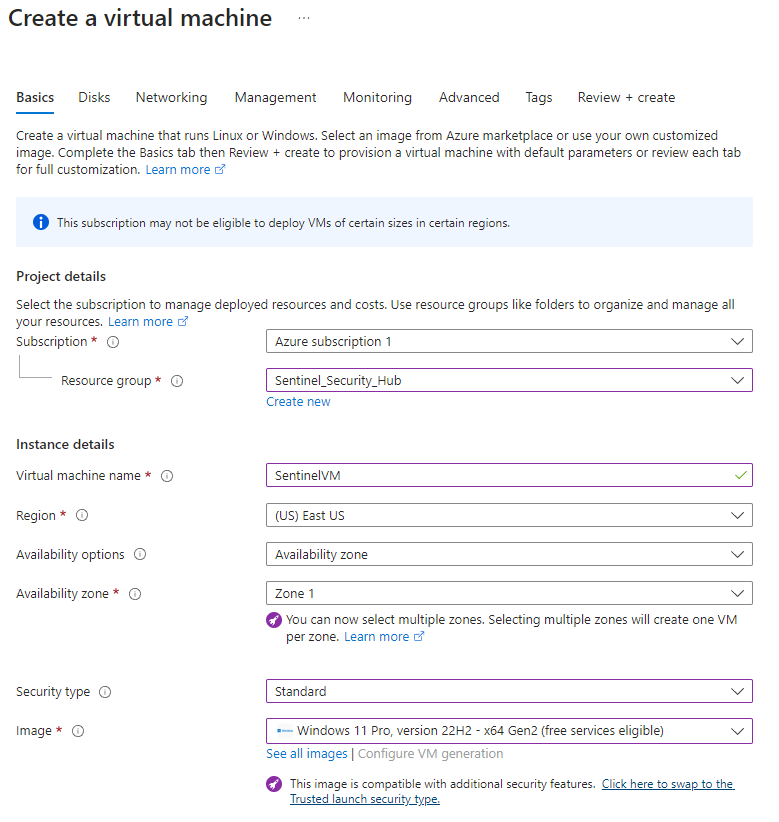
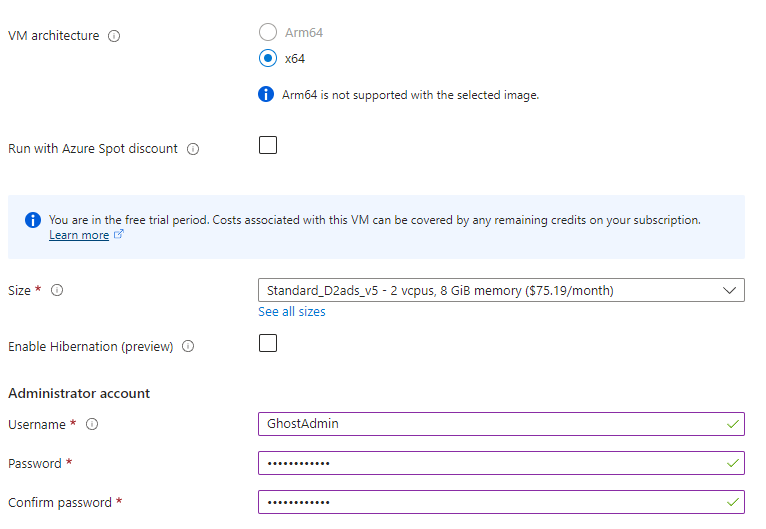
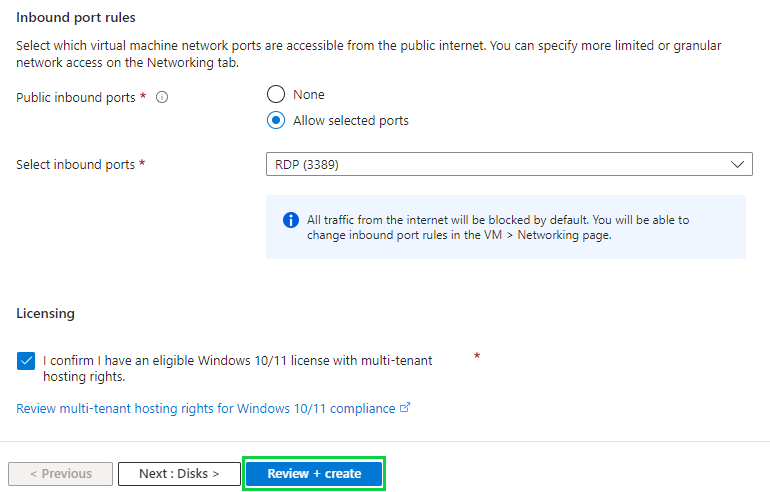
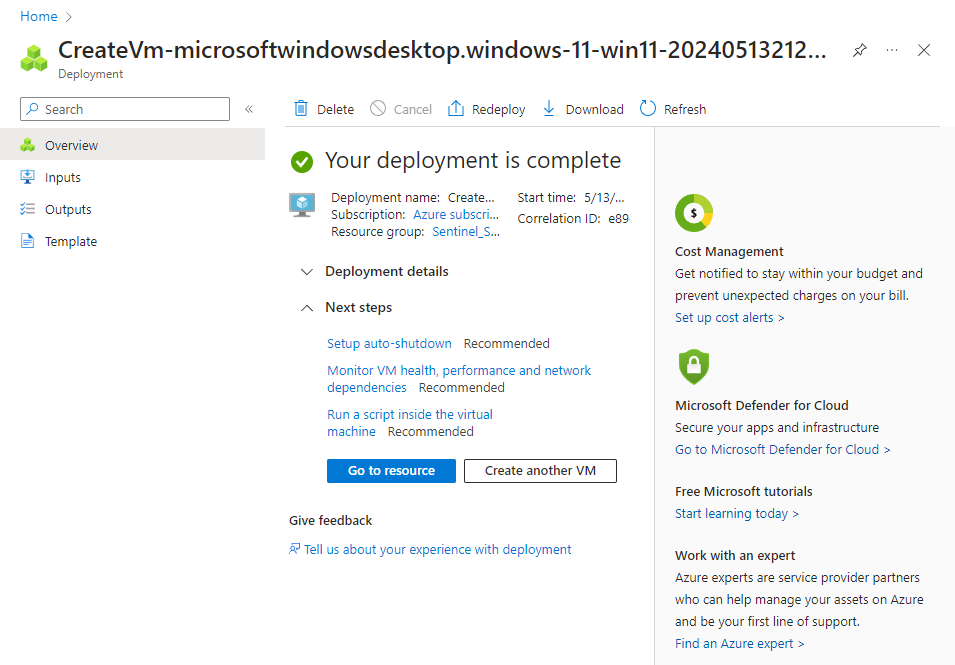
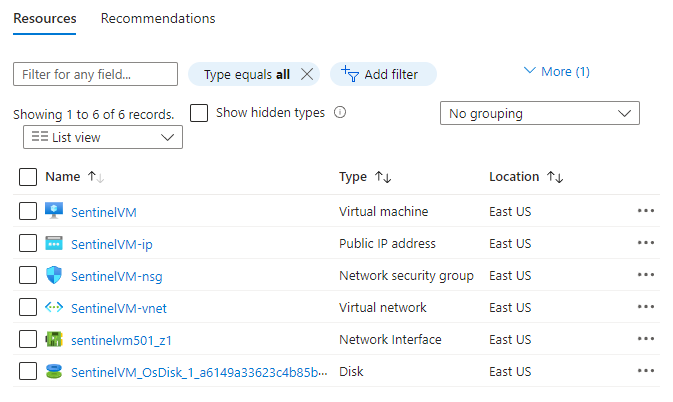
Now that we have our VM set up, we have it's associated Virtual Network (VNet) which has an assigned IP address and network interface. We also have an Network Security Group (NSG) configured with our VNet with default settings. This will be used to filter network traffic to and from Azure resources. Similar to a firewall, filtering is based on rules that dictate source and destination ports and network protocols that are allowed or denied.
If you look at the resource group created earlier, you'll see all this shown.
If we select our NSG, we'll be able to see the default rules in place.

If you look at the first rule, you will see that inbound RDP traffic is allowed from any source to any destination. RDP is necessary to access our Windows 11 VM. However, with this current setting, anyone who obtains our public IP (which can possibly be obtained via a network scan) can potentially connect to the VM as this is public facing. This presents a security risk as it makes the VM vulnerable to possibly a brute force or password spray attack.
In order to reduce our attack surface, we need to enable a security feature called Just in Time (JIT) access. This will provide restricted access to our VM via time-based restrictions as well as implements the principle of least privilege by giving the option to restrict access to certain IP’s as well as RBAC roles.
Anyone who wants access to the VM will need to request and based on their IP and assigned role they would be granted or denied access. By default, when creating your Azure Account, you are a Global Administrator so upon request you will be granted access to the VM.
To set this up, we will be going into Microsoft Defender for Cloud.
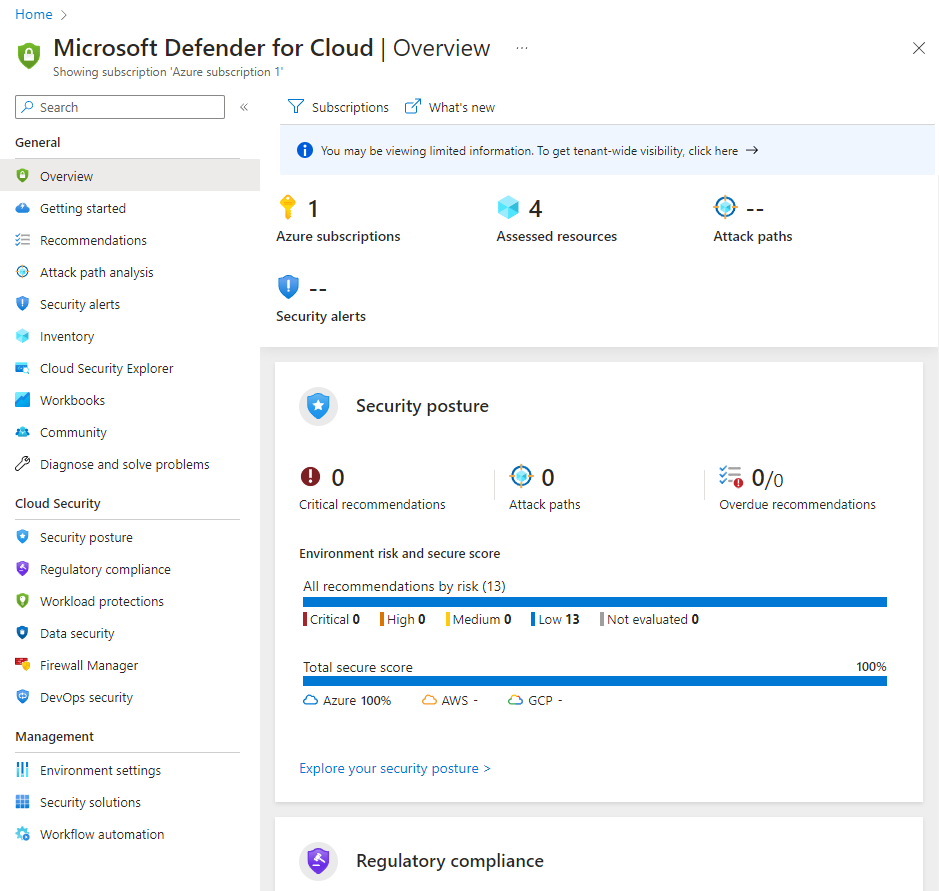 We'll be selecting our Azure Subscription here, but be mindful of which one you want to apply.
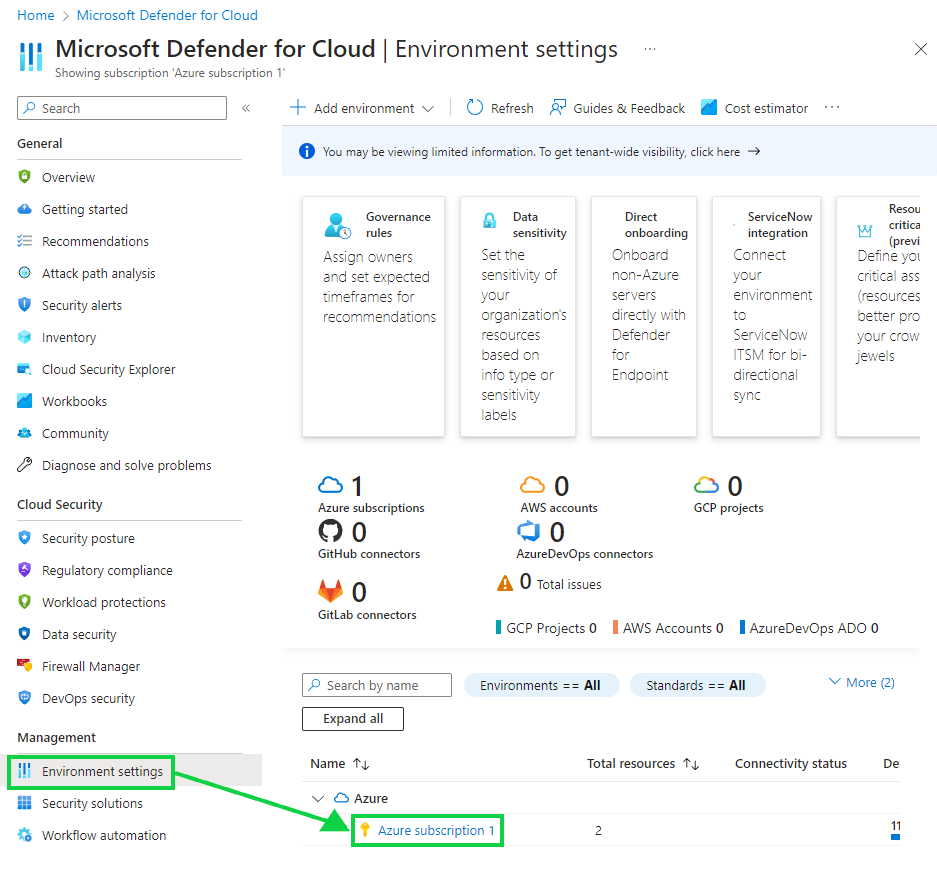
By default, Cloud Security Posture Management (CSPM) and Cloud Workload Protection (CWP) are off but you will want to select "Enable all plans".
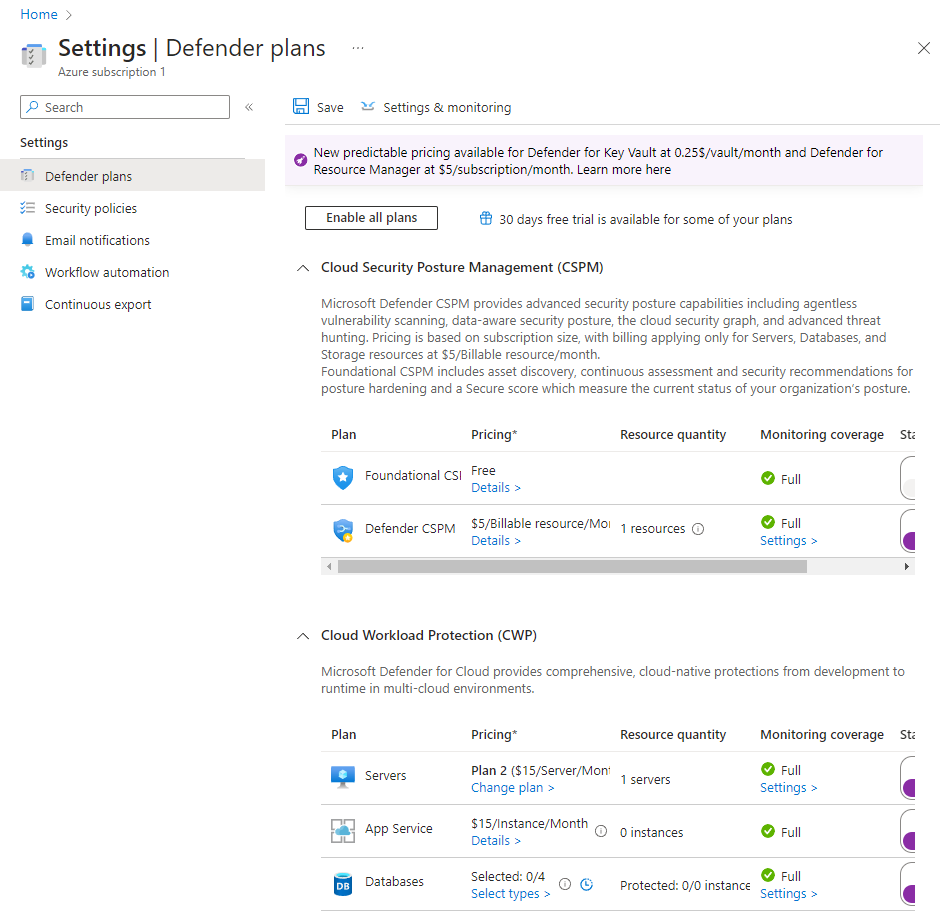
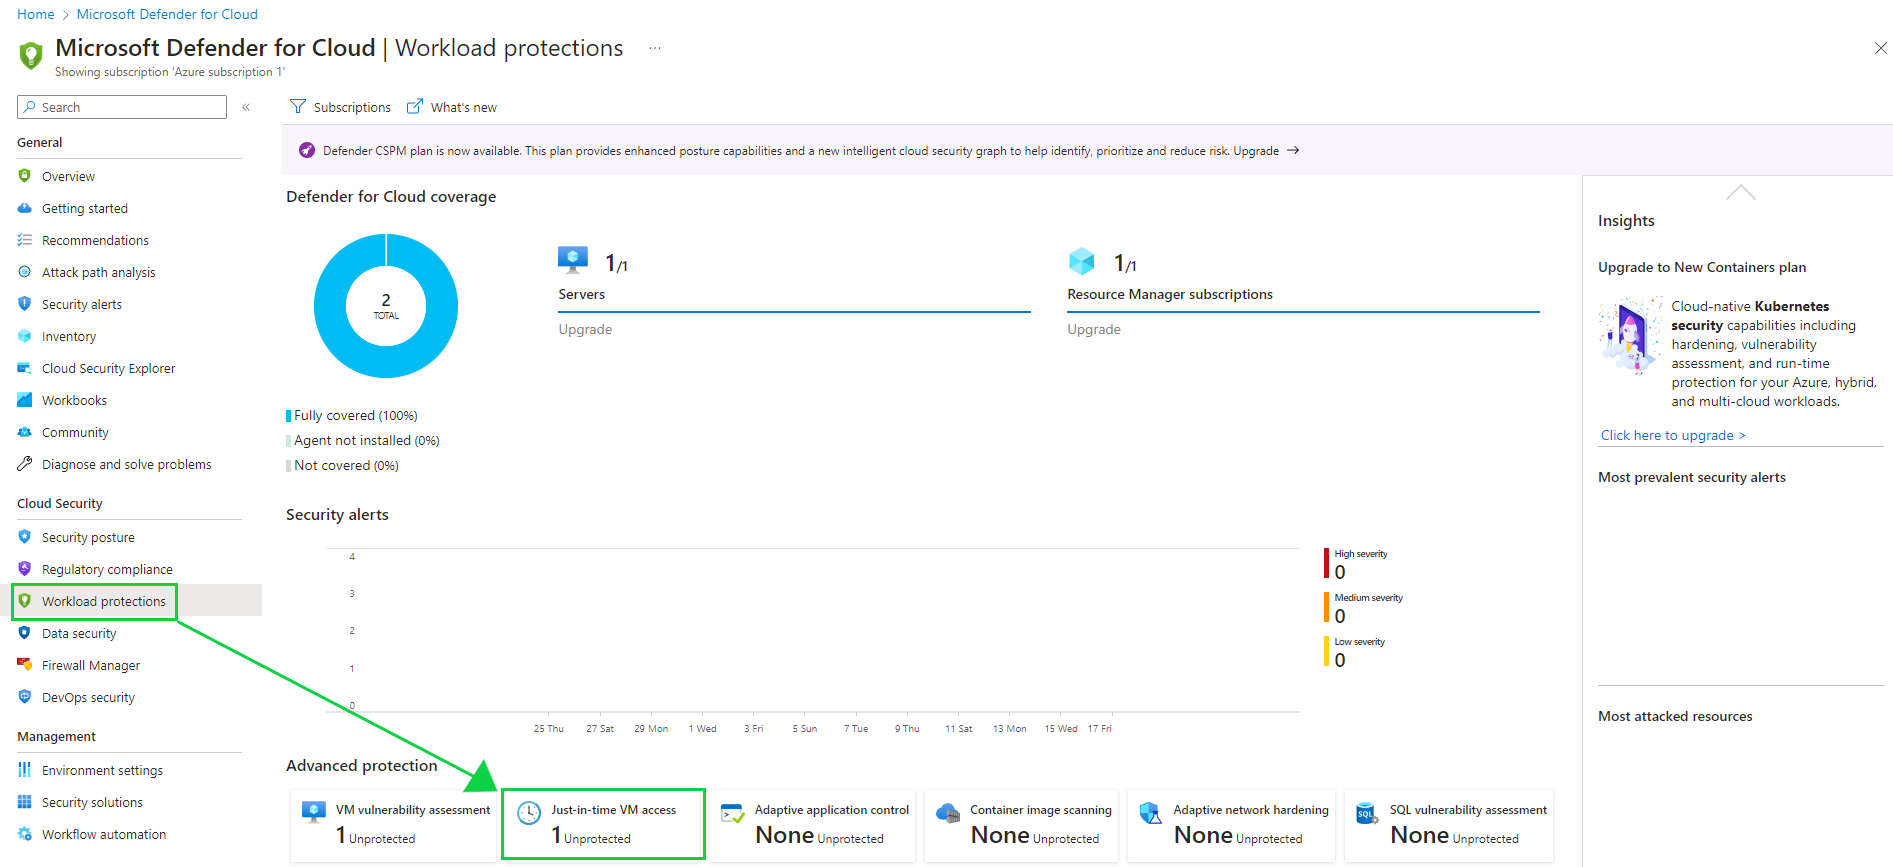
After enabling the plan, navigate back to the homepage for Defender for Cloud and select Workload Protections on the left pane. From here, you'll want to enable JIT. I went ahead with the recommended configurations but use discretion in regards to your own configuration.
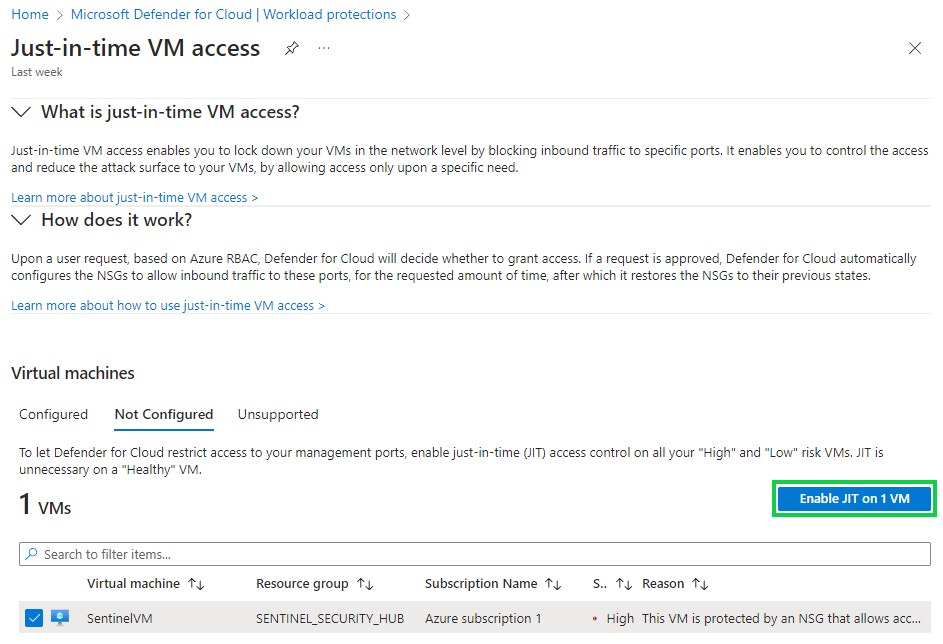
After you save these settings, anyone who is connecting via RDP or another management port will be constricted to a three hour time block upon approval which we will later grant.
Go to your VM settings and click Connect on the left pane. Select the "Local machine IP" as your Source IP then select “Request access”.
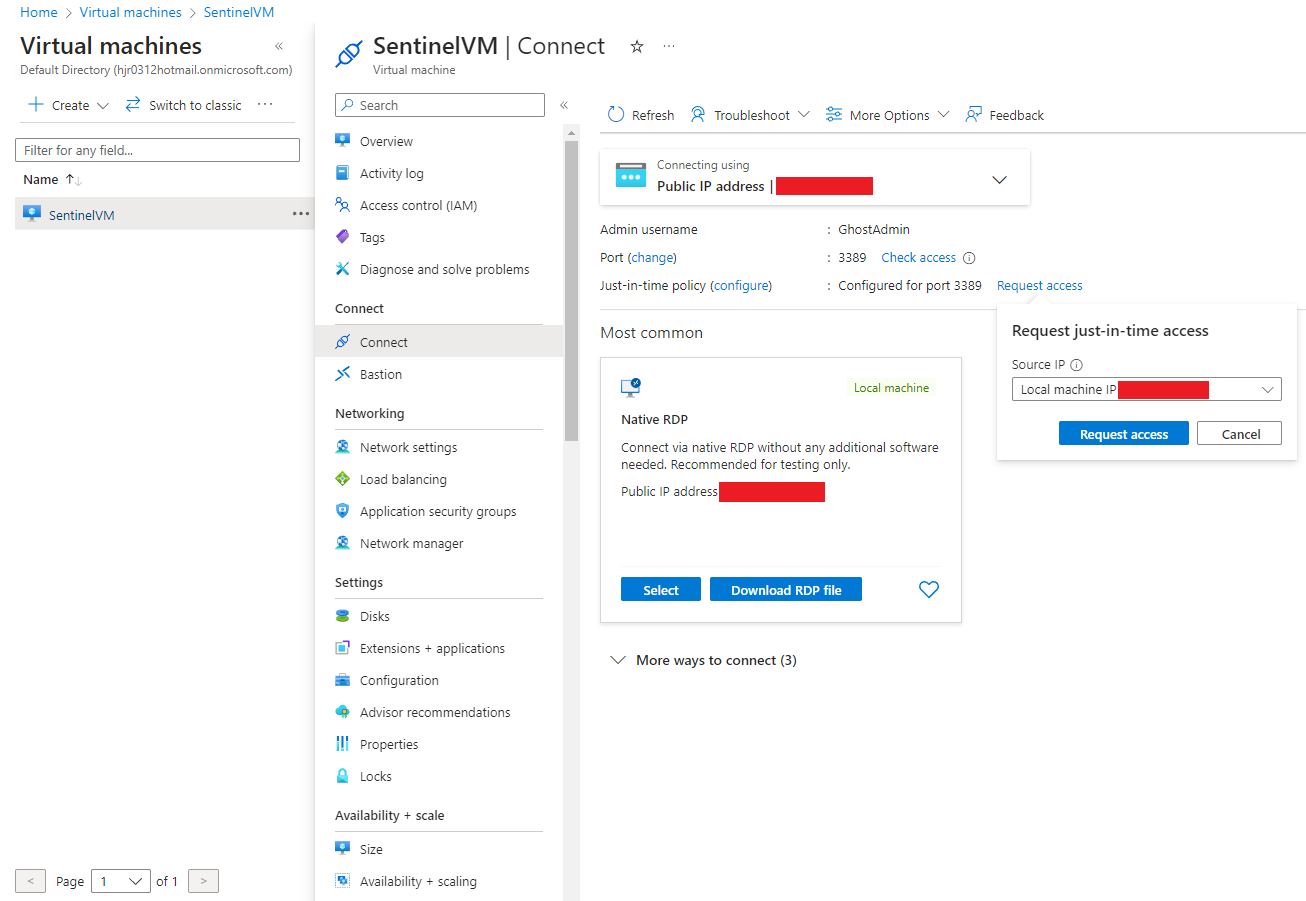
If we go to the networking tab for our VM, we can see our rules have been updated. Now RDP traffic is allowed for a certain amount of time only from the IP of your computer. Anyone else who attempts to establish a RDP connection will be blocked via our JIT access rules.

Step 3: Create a Log Analytics Workspace and deploy Microsoft Sentinel
When working with log data in Azure we need somewhere to store/operate that data. Log Analytics workspace is used to collect and store log data from Azure resources.
Search “Log Analytics workspaces” in the search bar in Azure Portal. This will prompt you to create a Log Analytics workspace. Use the same resource group used for the VM you created in the previous step when filling out the necessary fields to create your Log Analytics workspace.
Once you have those settings in place, Select "Review + Create" to launch that resource.
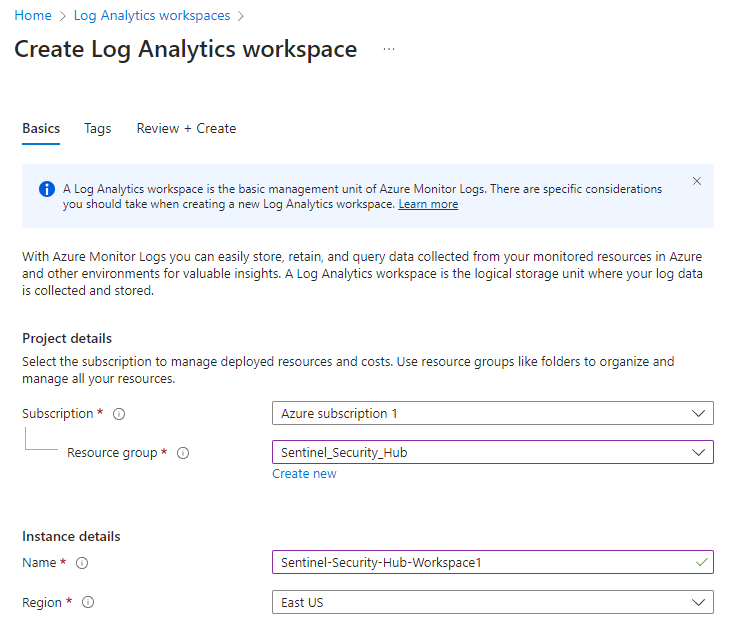
After that, search for "Microsoft Sentinel" and add that to your created workspace. Remember to select "Add"
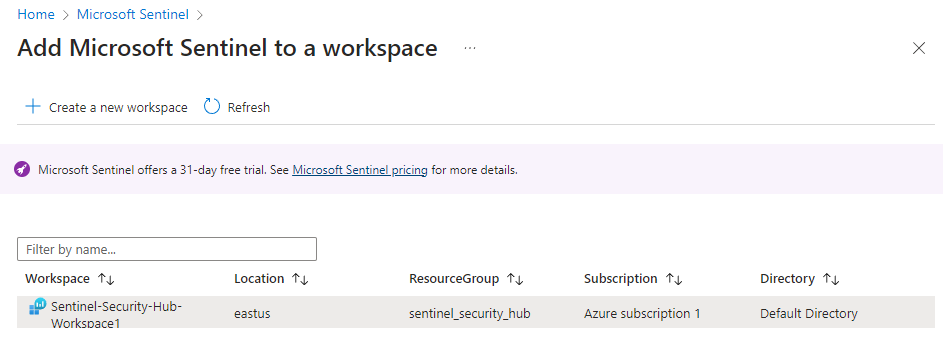
Part 2: Getting Data into Microsoft Sentinel
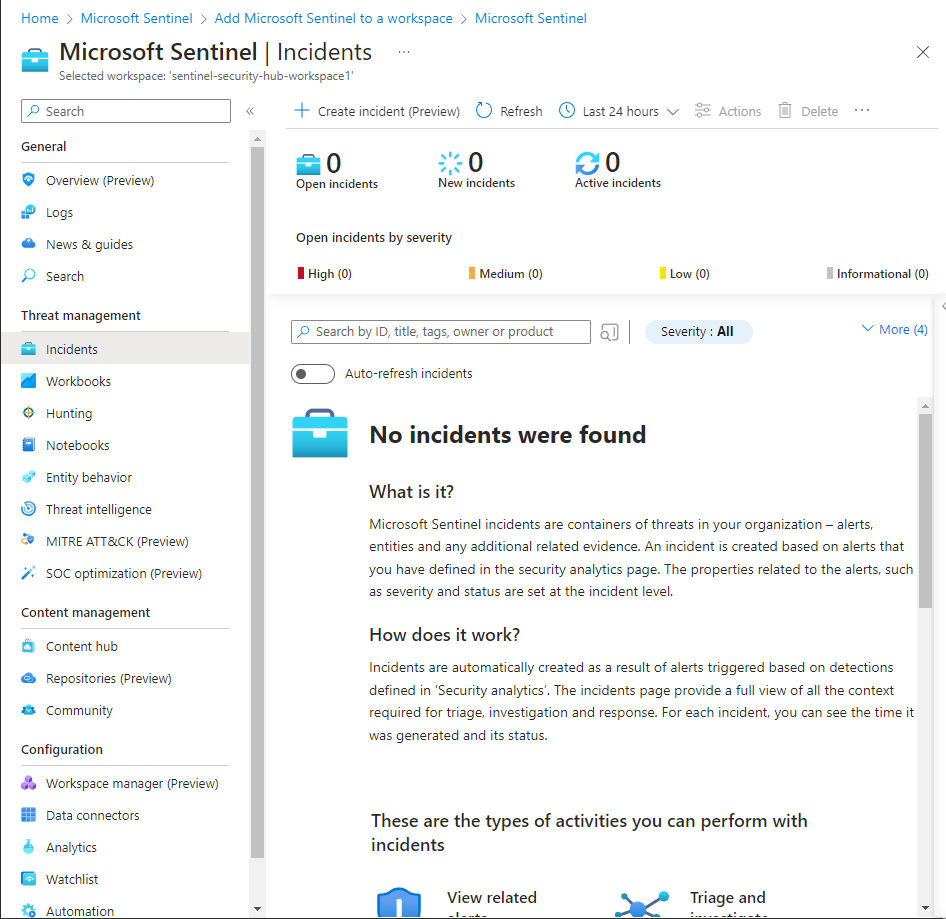
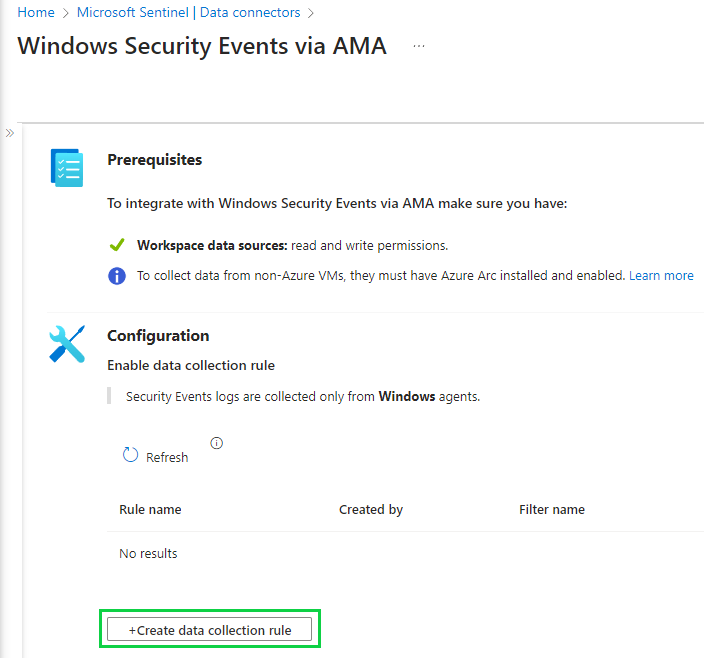
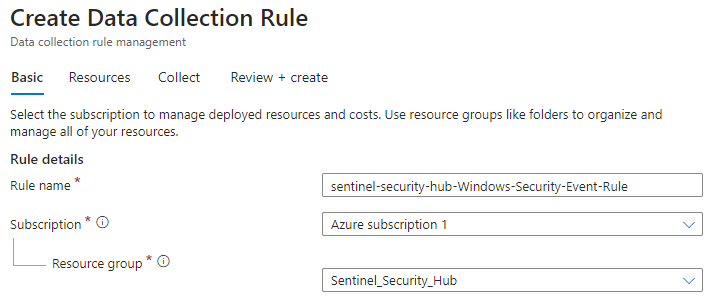
After the Microsoft Sentinel deployment, if we go into the incidents tab on the left we will see we don’t have any incidents currently as there is no data being fed into Microsoft Sentinel. We're going to utilize data connectors and create a data collection rule to bring in data from our VM.
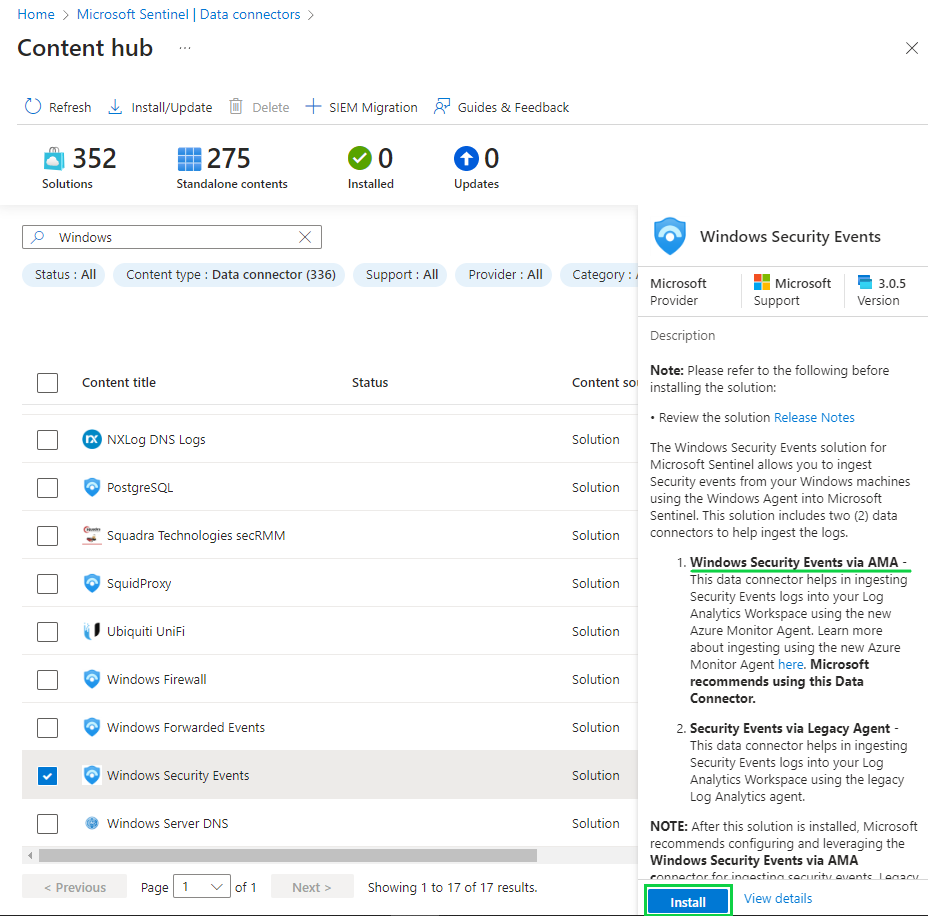
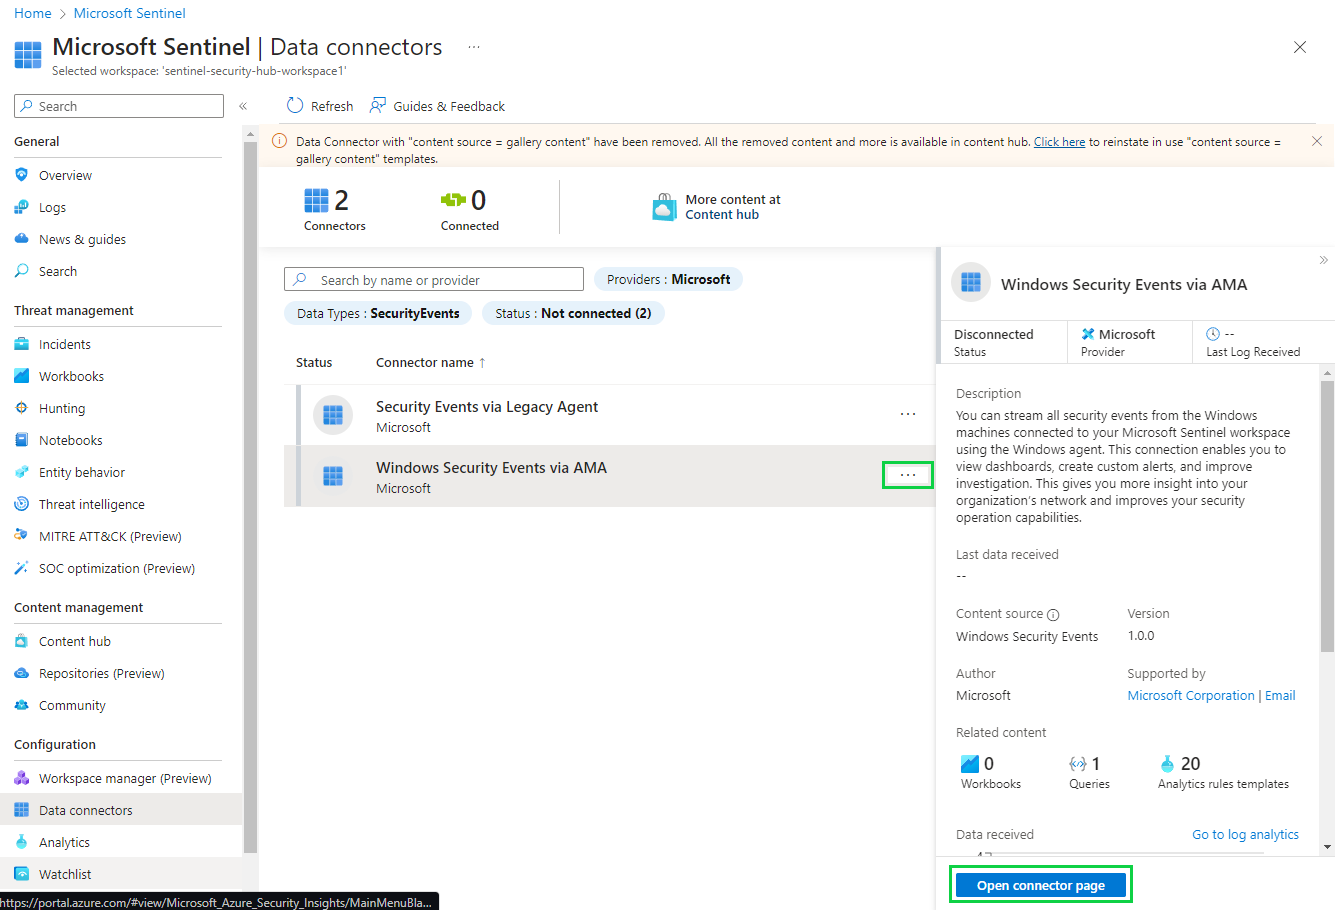
Go to the "Data connectors" tab. This is where we can select the type of data that we want to bring into our SIEM. We'll want to install "Windows Security Events via AMA" so that we can collect data regarding Windows Security Events.
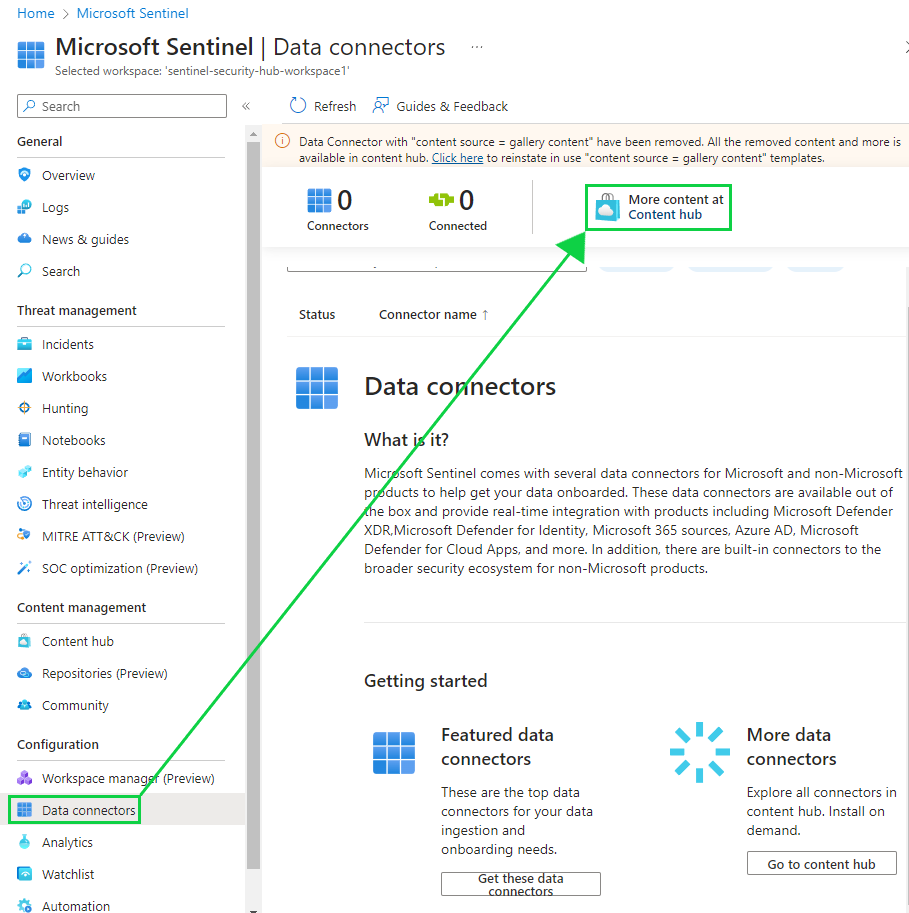
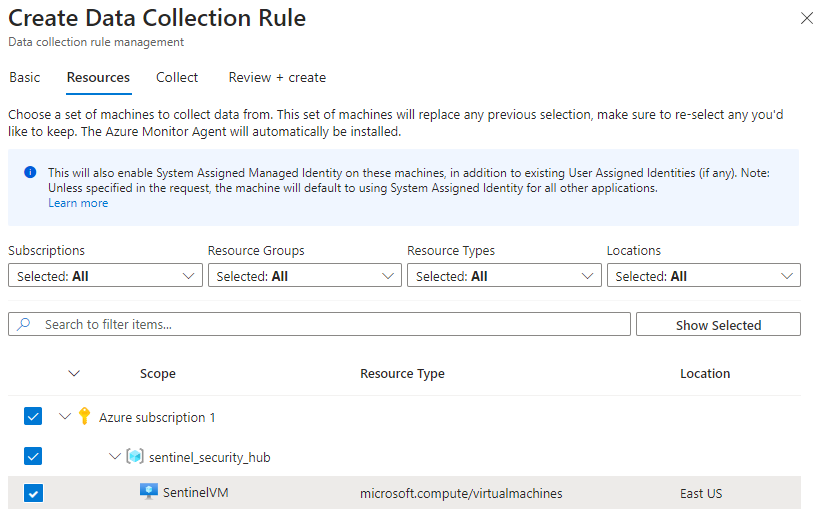
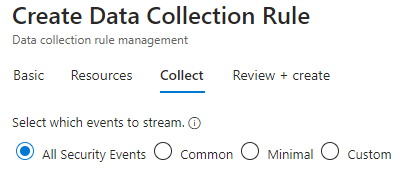
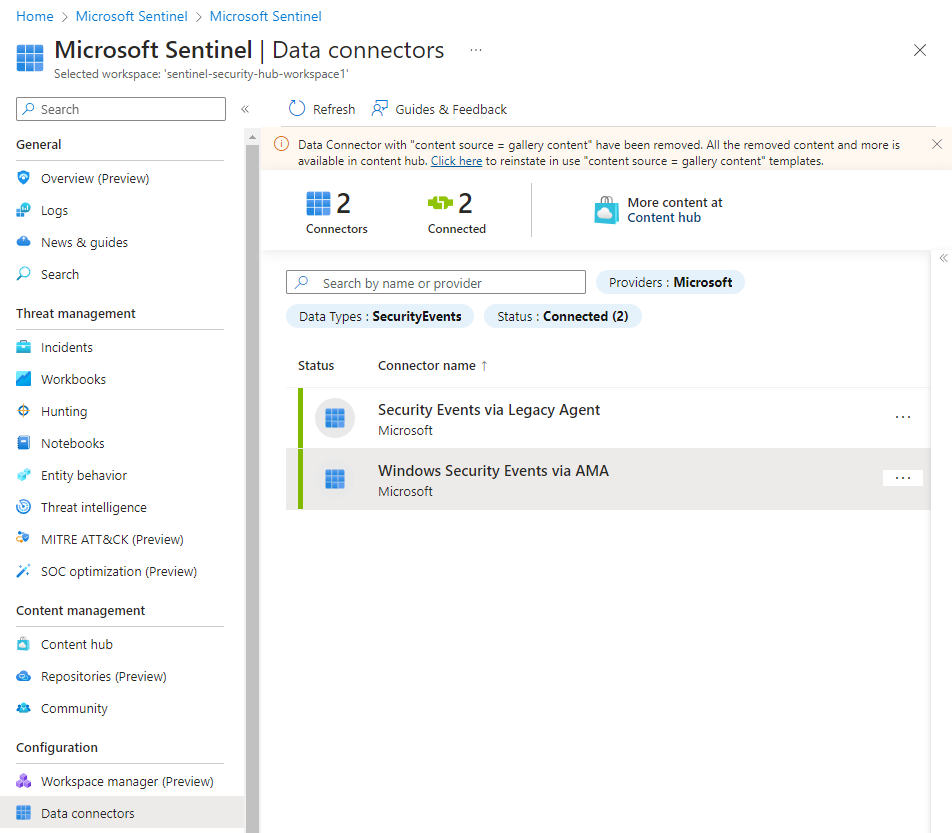
See how now the data connectors are green in those bars? That means they're connected and running.
Part 3: Generating Security Events
Now that our VM is connected to Microsoft Sentinel and our Log Analytics Workspace, we need to transport data from our logs. To do this, we'll need to perform some actions on Windows 11 events that will generate security alerts.
Windows keeps a record of several types of security events. These events cover several potential scenarios such as privileged use, logon events, processes, policy changes, etc.
We will now observe some Windows security events on our VM, so we'll ensure the VM is started and running. In the "Networking" section, you will find a public IP address. Use an RDP client, such as Remote Desktop Connection (RDC) to access your VM by entering in this public IP address.
Note: You might need to refresh the page after starting the VM for the public IP address to appear.
In the Connect area, you'll find a quick configuration setup to prepare your RDC connection, which we'll use.
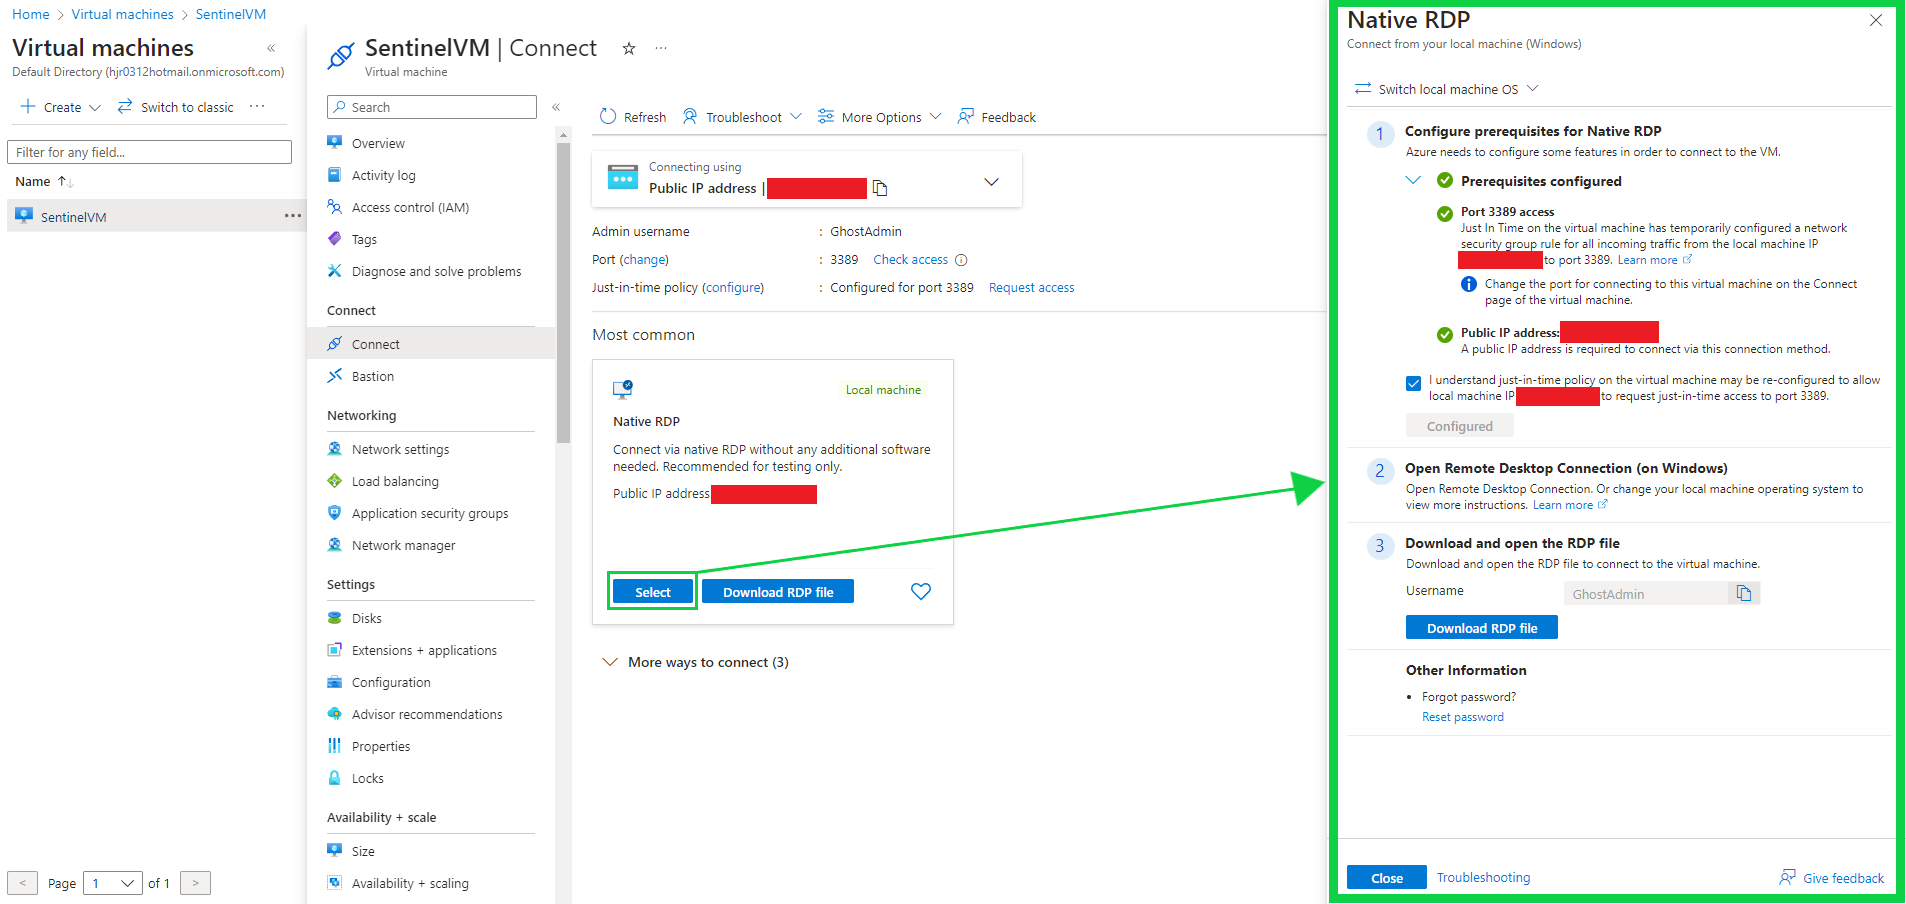
Enter the IP address, Username and Password created when the VM was made.
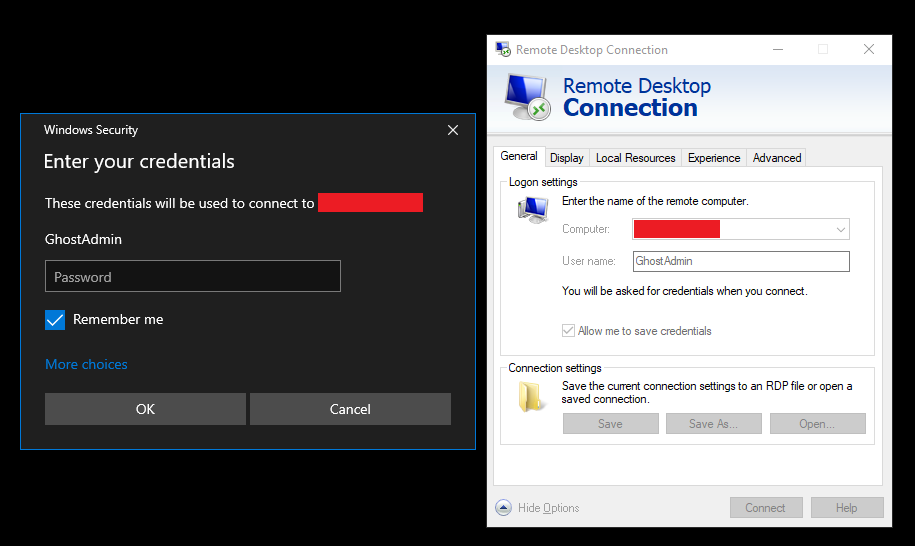
Once we're in, we'll head over to the Event Viewer. We'll set our focus on the Security Windows Event Logs (WEL's), specifically Event ID's of 4624 since that contains events of successful account logon activity, an important security event to keep track of.
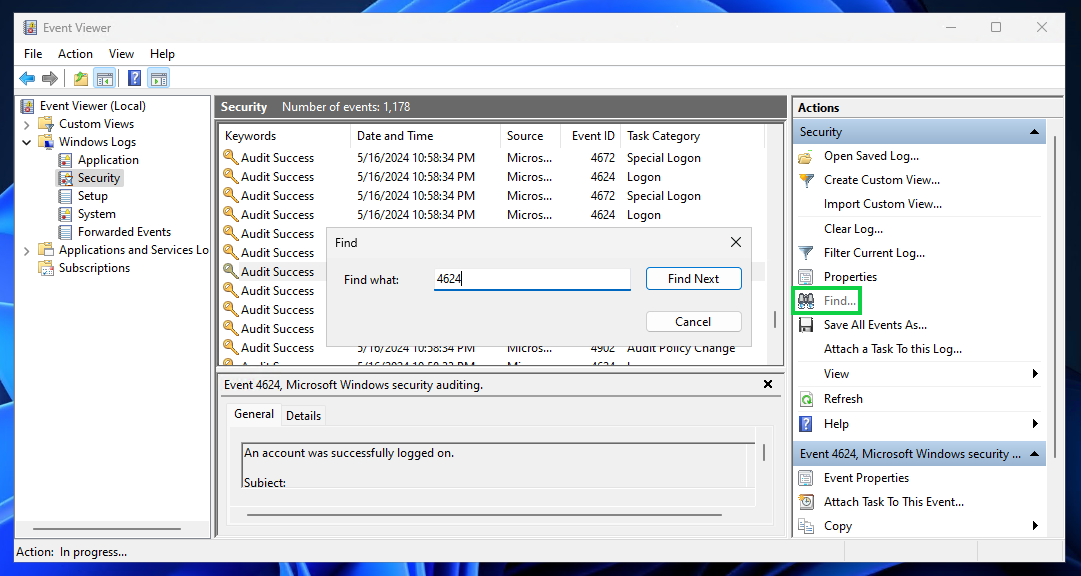
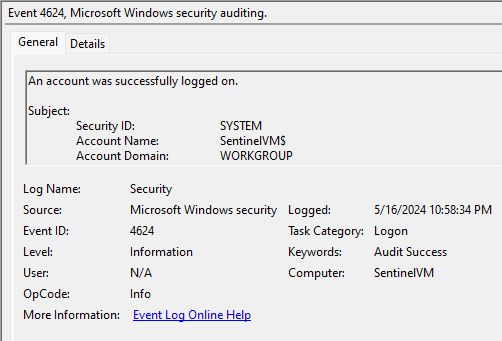
Part 4: Kusto Query Language (KQL)
The purpose of a SIEM such as Microsoft Sentinel is to bring data like this into a centralized location. In an enterprise, we would want data coming from all our endpoints and VMs. In this example, we will pull this specific event log within Microsoft Sentinel.
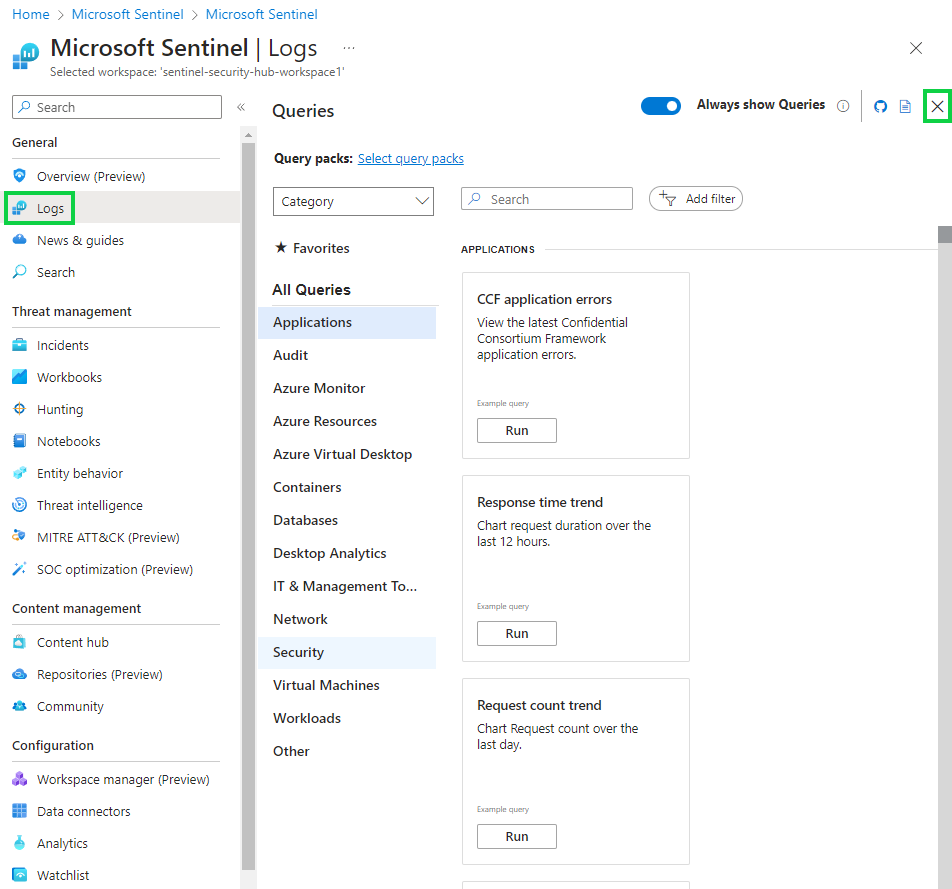
By hitting that X button, you'll be brought to the KQL query custom writing area. We'll be writing with this logic here to pull those logs.
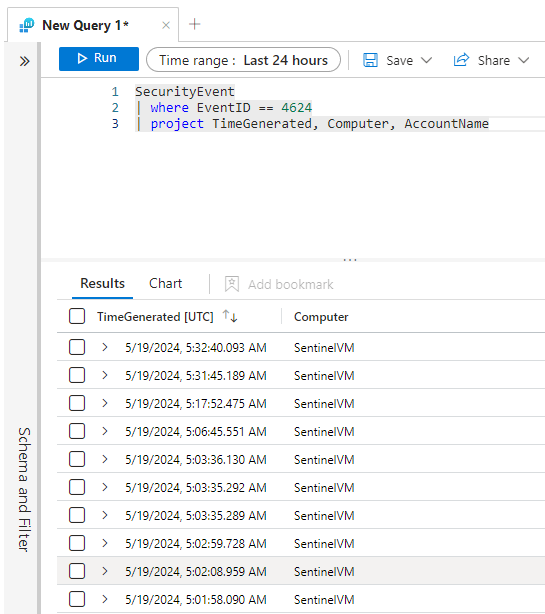
While I won't be reviewing all of KQL's syntax here, Microsoft does a pretty good job at reviewing over that with their documentation, which can find here.
Put simply, this query will pull security events where the event ID is 4624 and only pull back the time the logon event occurred, what computer it came from and what account generated the event.
Now, since AccountName isn't generating data, that column is going to be blank. We need Microsoft Sentinel to put in that data for us. We'll address this later when we create our analytic rule.
Part 5: Writing Analytic Rules and Generating Scheduled Tasks
Before we create our analytic rule, we'll need to set up a scheduled task on our VM in order to populate some data.
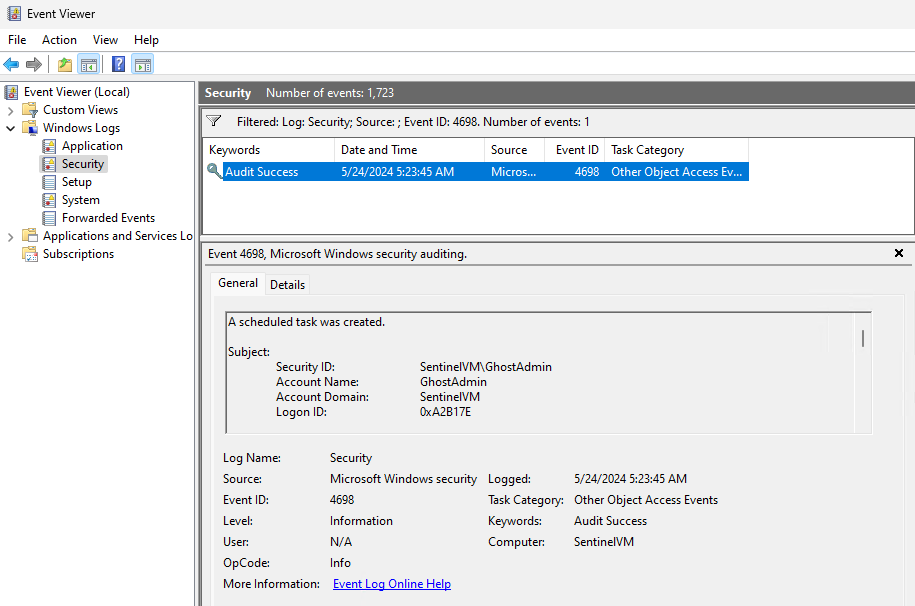
The Windows Security Event ID that corresponds to scheduled task creation is 4698. However, these events are not logged by default in the Windows event viewer. To enable logging for this event we need to make some changes to the Windows Security policy in our VM.
We'll go into our Local Security Policy and expand out "Advanced Audit Policy Configuration" then drill down to "Object Access". You'll then want to select "Audit Other Object Access Events"
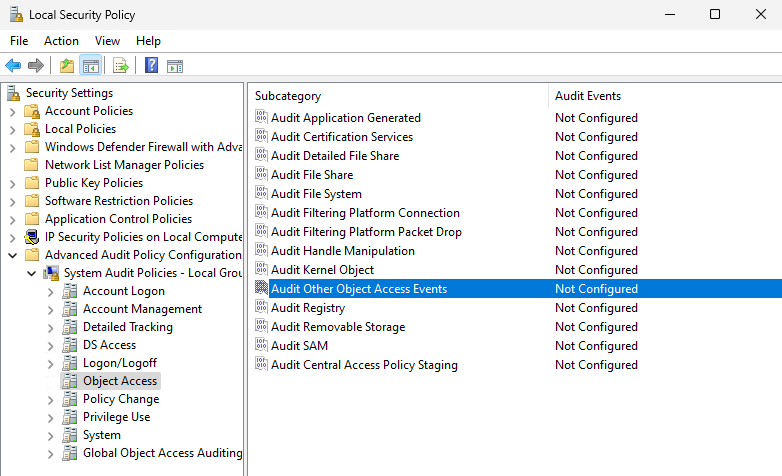
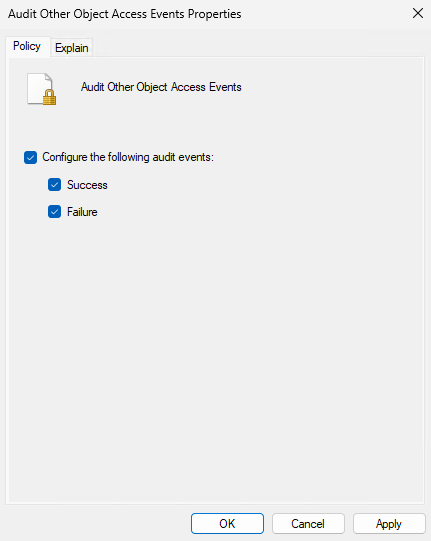
Logging will now be enabled for the scheduled task event. Now we'll go ahead and make the scheduled task itself.
Open Task Scheduler and navigate to “Create Task”, Add a name and change the “Configure For” OS to Windows 10 (There is no Windows 11 option as of May 2024 but if this changes in the future, use that option instead).
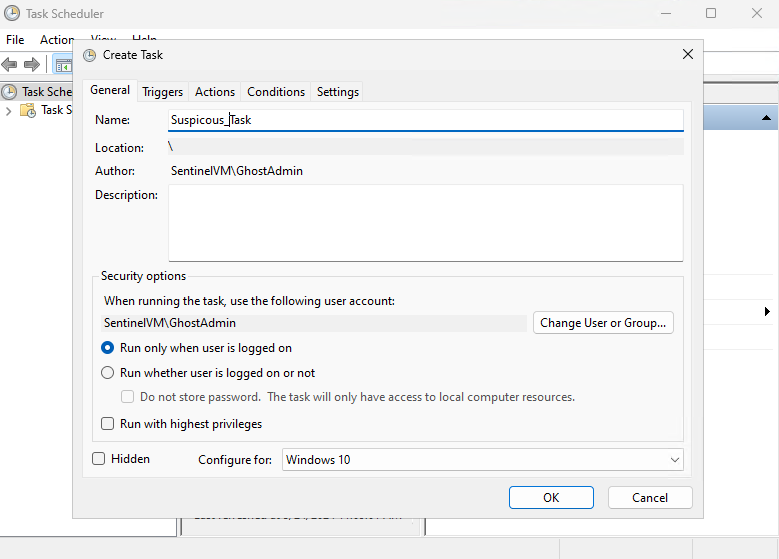
You'll then want to implement your trigger. Select “new” and schedule the task for a time close to your current time. Then select “OK”.
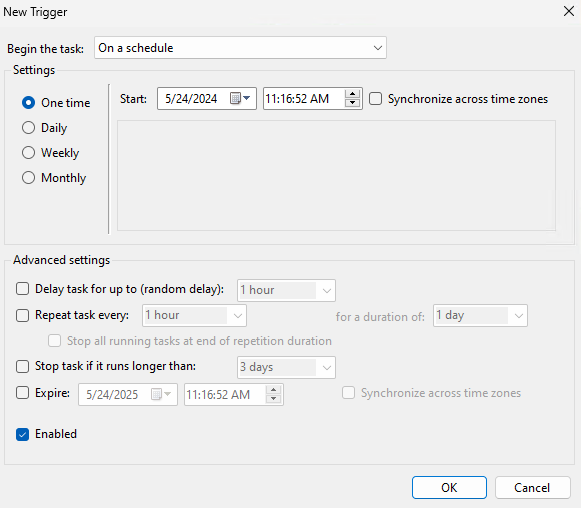
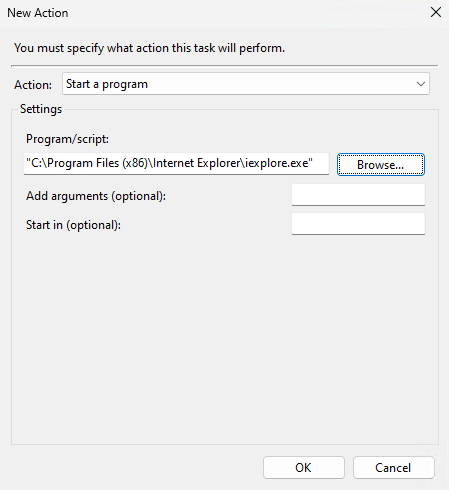
Lastly, we'll need to set up an action. Navigate to the action section, select "new," then select "Start a program". We'll configure the action of opening up Internet Explorer everytime this task runs.
Once that all is done, select "OK" and now that your scheduled task is made, you can go into event viewer and search for that Event ID 4698 in the security logs. You'll see our created scheduled task event there.
Now that we have our scheduled task set up, We'll create a custom analytic rule that will check our VM for the activity that matches the rule logic and generates an alert anytime that activity is observed. These details in such an alert can help start an investigation into determining whether the alert event is a false positive or not.
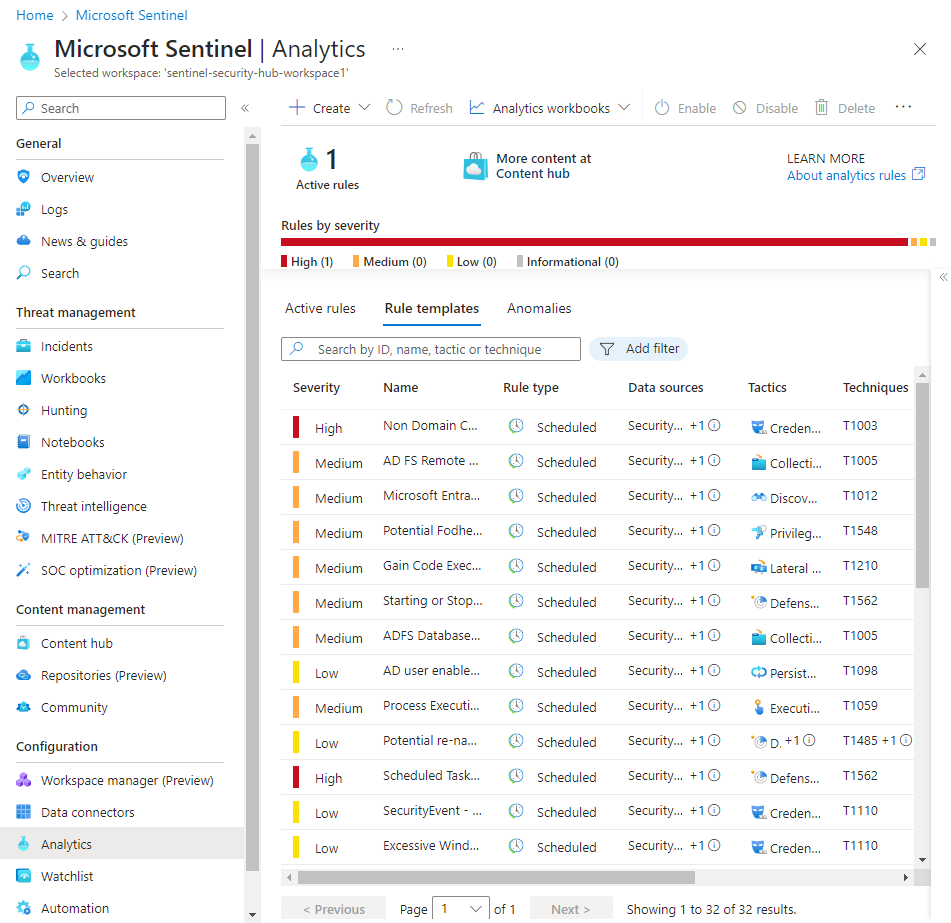
These are a list of alerts that we can enable our SIEM to monitor that come out of the box. If you wish, you can expand some and see what they are comprised of by right-clicking them and selecting "Create". These rules will only fire if the logic is met by a security event on your VM.
For our example, we will be creating an analytic rule that will alert us whenever a scheduled task is created on a host. You'll want to consider the MITRE ATT&CK framework and the tactics, techniques, and procedures (TTP's) when writing out these rules. In this case, Persistence is the technique we'll be tracking here. We'll want to create a scheduled query rule for this.
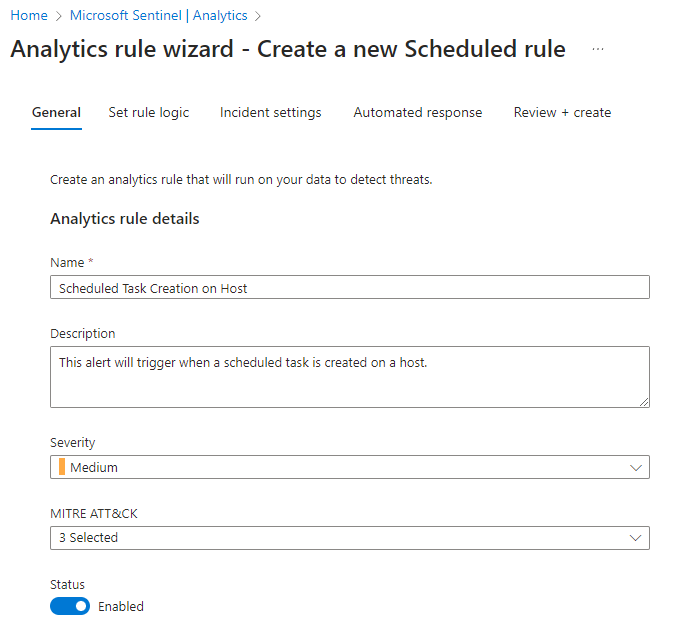
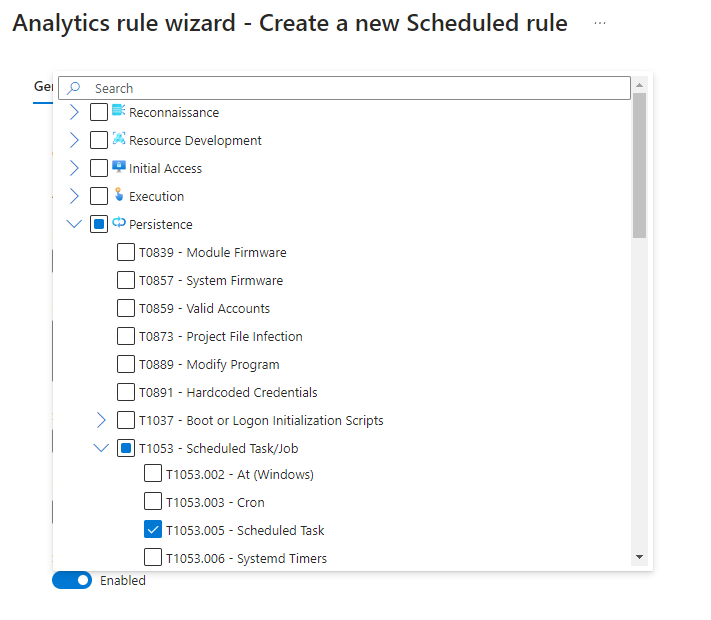
Next we will set up the rule logic that will cause our alert to fire.
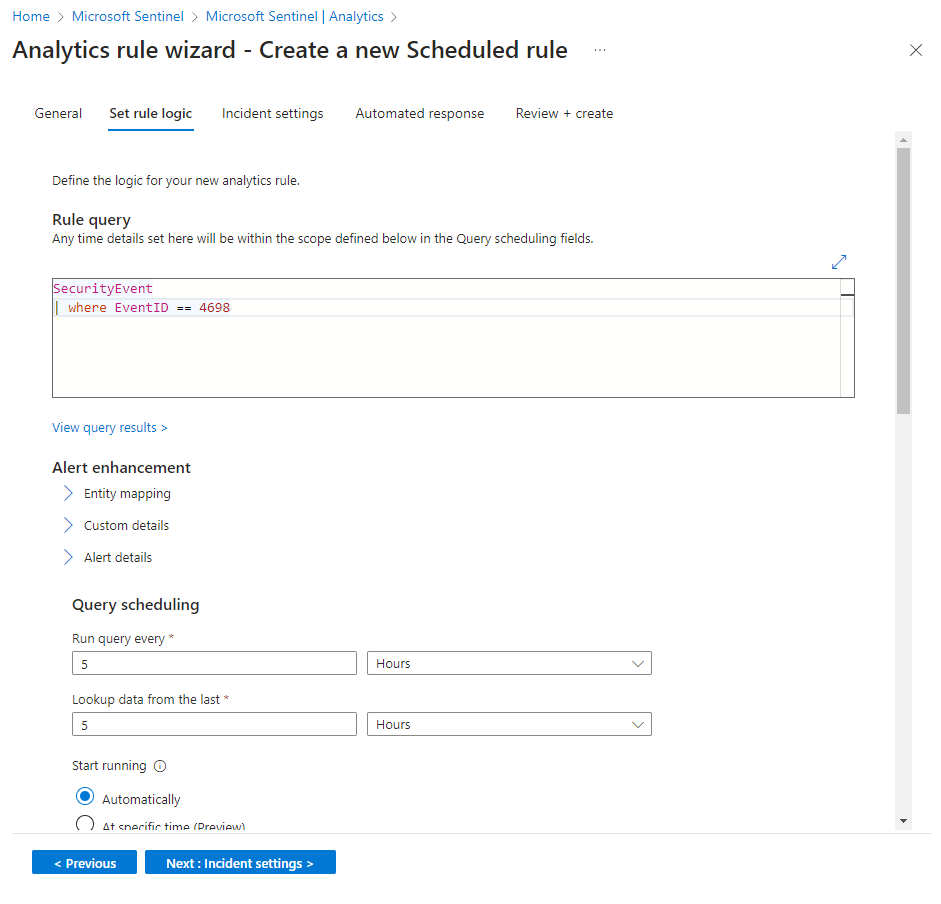
Now before we go any further, let's check out the results of our query first by selecting "View query results".
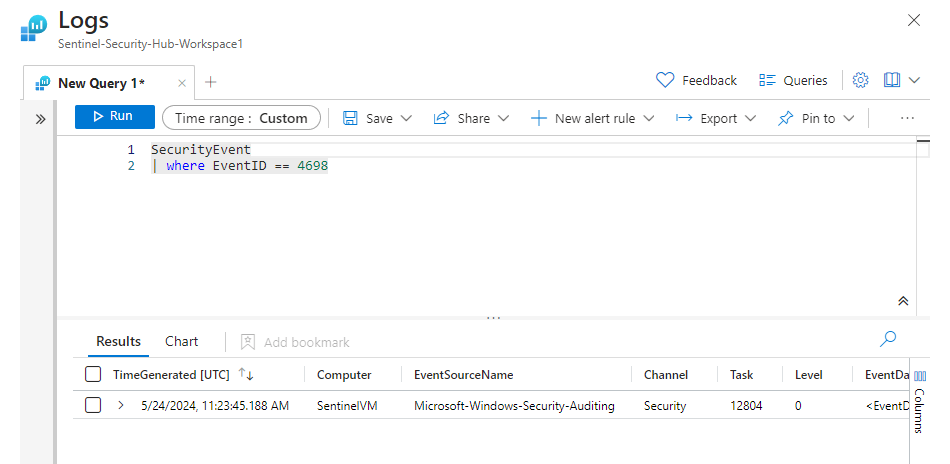
We can see now that scheduled task we made. If we expand that out, we'll see all of that Security Event data. We want to focus on the EventData category for
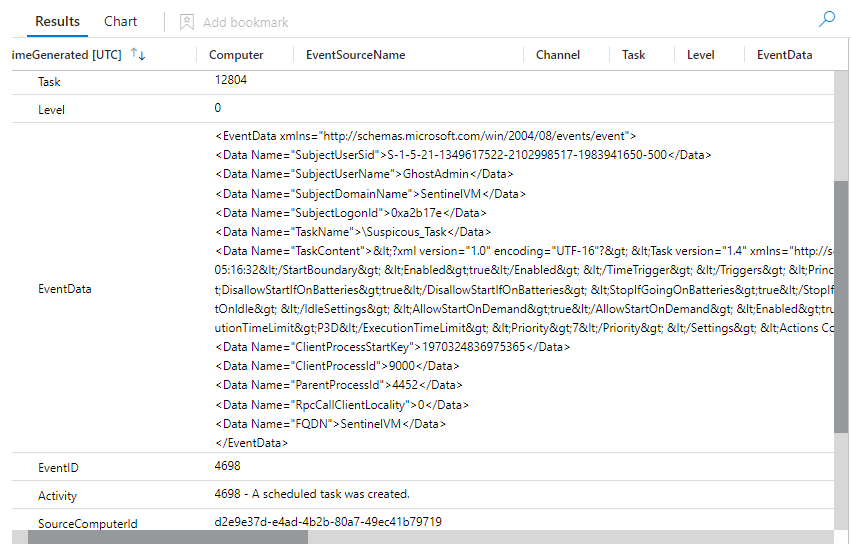
The data we pull from this area includes stuff such as the "TaskName", the "ClientProcessID", and the "SubjectUserName", which is username of the account that created the scheduled task.
Now if we go back to writing our KQL query, We'll go ahead and put in the Project and Parse logic. The former will display our data fields as columns and the latter will extract data from the Event Data Field.
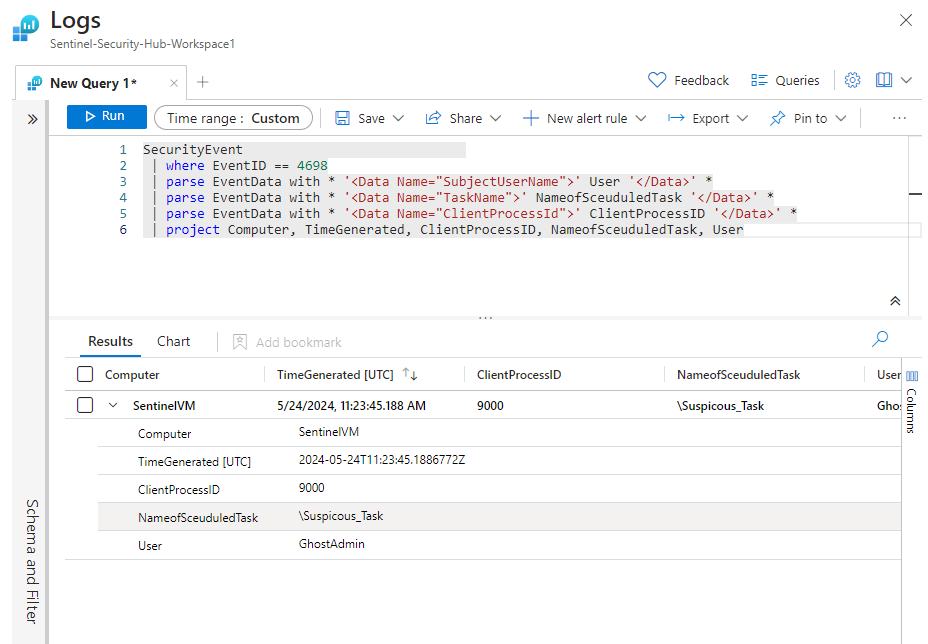
See how much cleaner that looks? Now let's go back to editing our analytic rule with this new KQL query. You'll notice the "Alert enhancement" area which allows us to add context to the alert to make it easier to read.
As opposed to having to query this data as we did in the analytic rule, this will allow us to put the necessary data into the alert details as "Entities" so we can investigate specific components. We'll use the data we pulled in our KQL query for the Entity mapping.
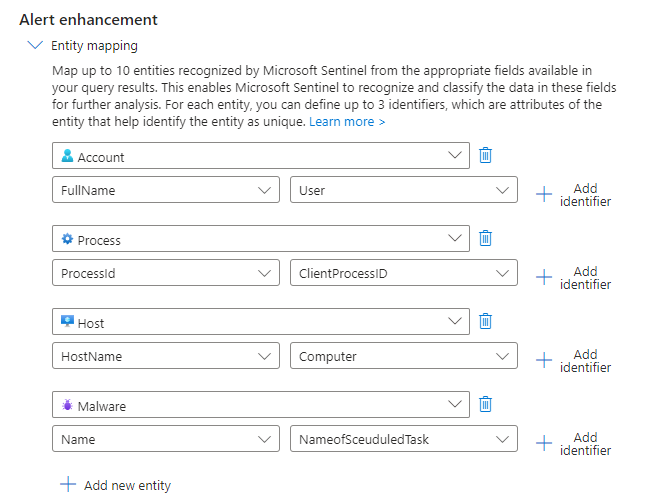
The only other setting that we'll change is how often the query is run and when to look up the data. Change the defaults to the following:

We're going to ignore the Incident Settings and Automated Response sections and just review and create the analytic rule. Now if we create another scheduled task in our VM, it'll trigger that rule in Microsoft Sentinel.
Note: that since we made the query run every five minutes, it'll take the rule to trigger.
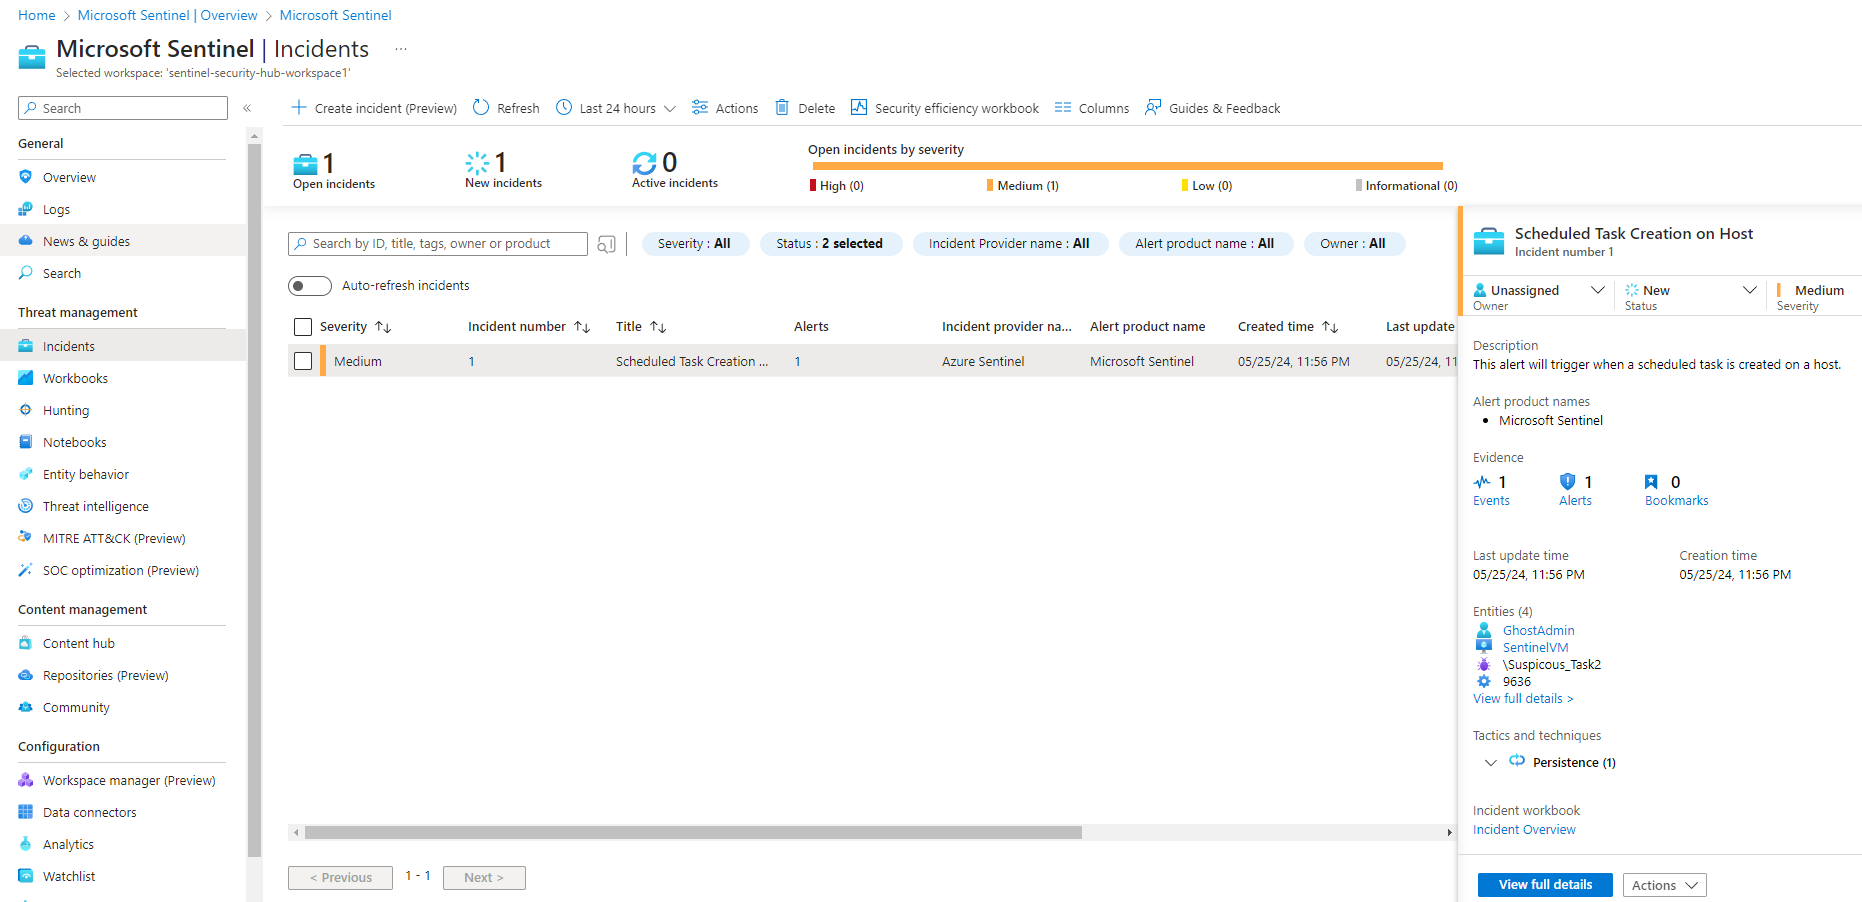
On the right pane you'll see all the necessary information needed to begin investigating the alert such as the host machine, user account, process ID of the task, and the name of the scheduled task.
In this case, the scheduled task is non-malicious. in the event it was however, you'd want to investigate the entities such as the user account, the scheduled task, host, etc. This begins the lead up to EDR solutions and other security tools to decide if this is a false positive or true positive.
Part 6: MITRE ATT&CK Framework Composition
Now that we have detected attacker presistence successfully in Azure, let's go ahead and map out what occured in the MITRE ATT&CK framework and how we can properly mitigate this attack. This is also useful to do if follow up reporting is required.
The observed MITRE ATT&CK tactic used was TA0003 Persistence which essentially allows a malicious threat actor to maintain a foothold in an environment.

If we scroll down, we'll see the technique used (T1053, Scheduled Task/Job).
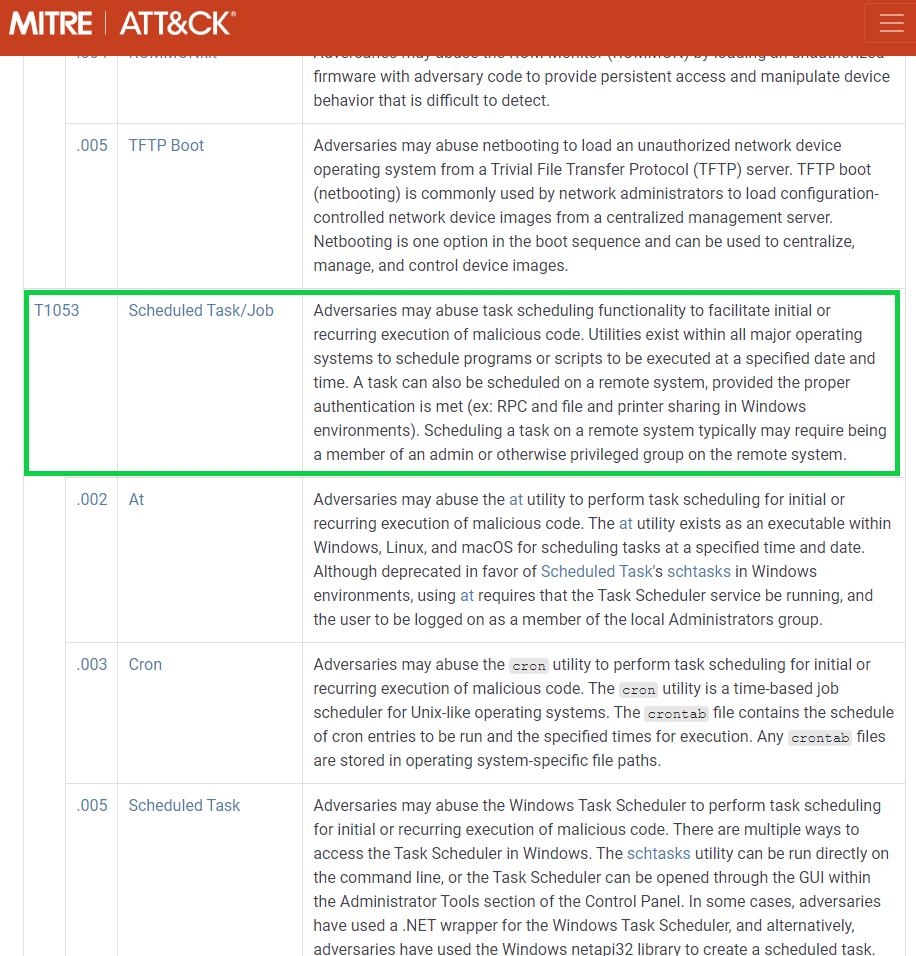
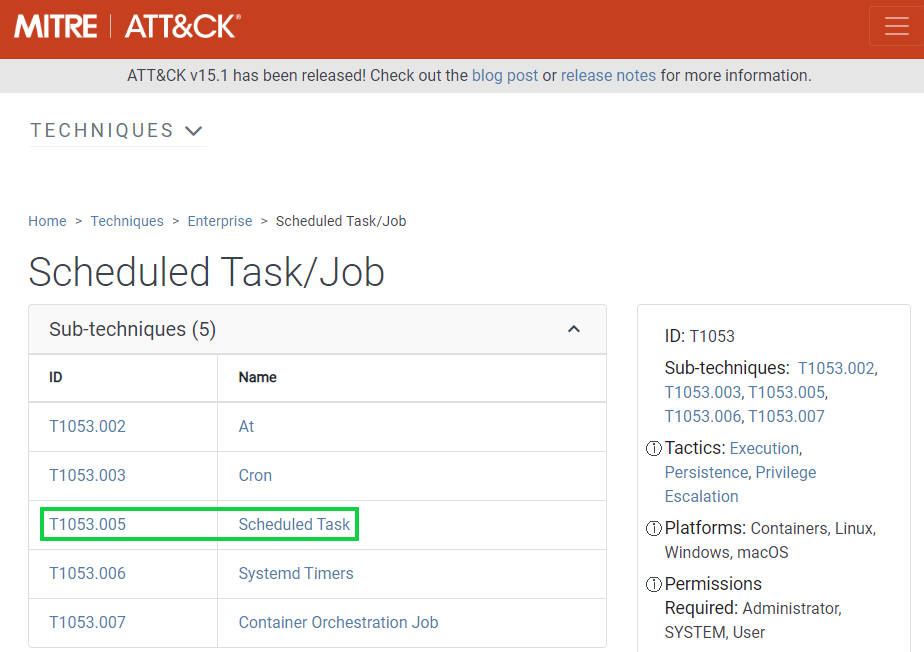
We'll then see all the sub-techniques, with ours being T1053.005 along with multiple procedure examples of ATPs, mitigation and detection tactics.
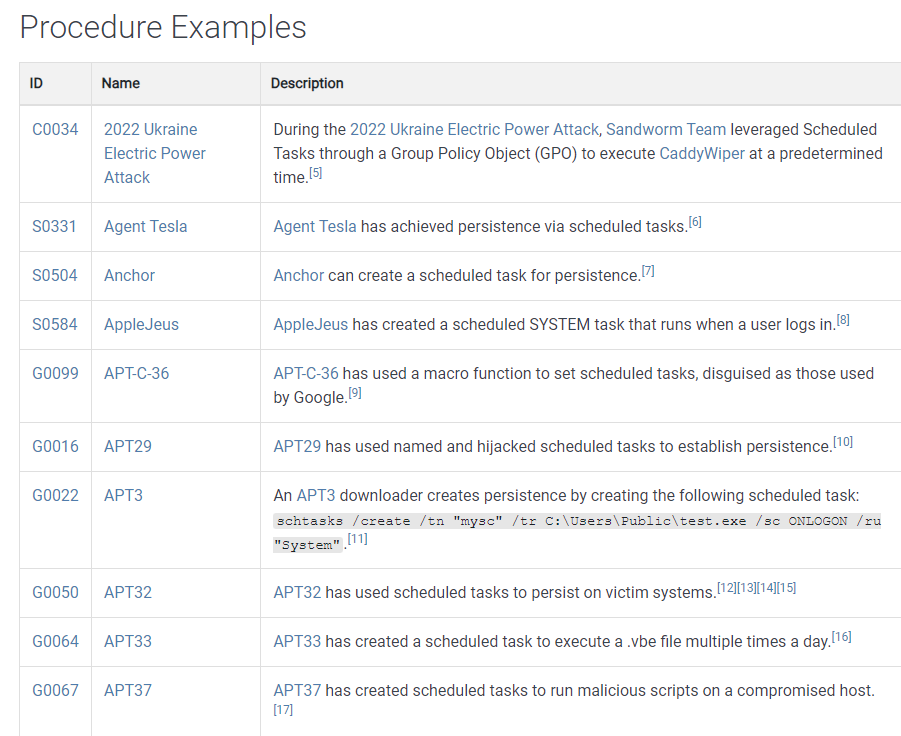
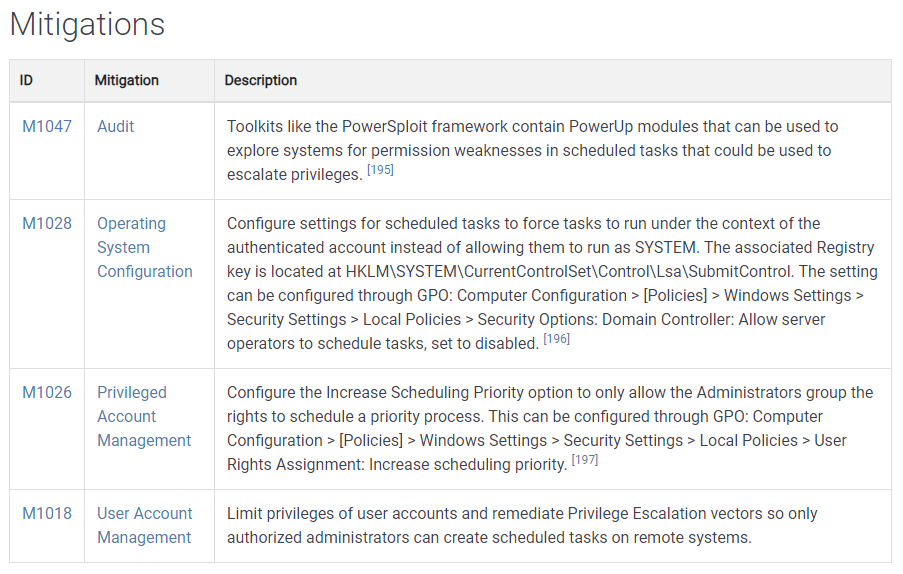
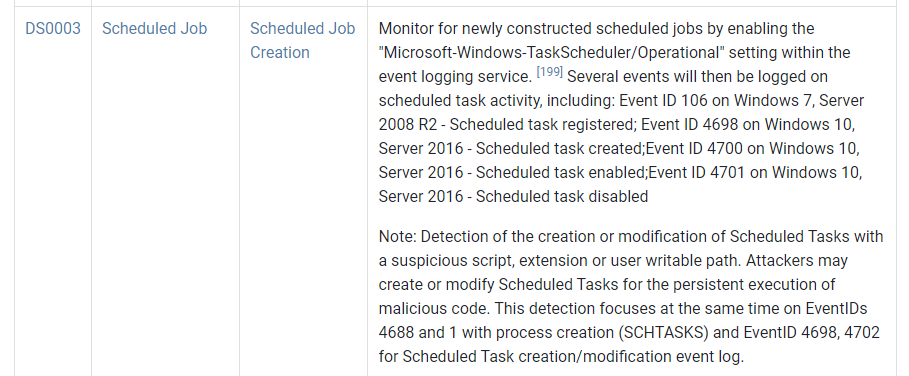
If you under the detection section, you'll see where we found our detection ID, Data Source and Data Component (DS0003, Scheduled Job, Scheduled Job Creation) that we used within Microsoft Sentinel, that being Event ID 4698 on Windows 10, Server 2016 - Scheduled task created.
If you got to the end of this in one piece, congratulations! You should now know how to work with Microsoft Sentinel and some aspects of Windows and Azure.